In today’s complex world of web applications, optimizing API performance is critical. Whether it’s the frontend user experience or backend service responsiveness, a bottleneck at any point can lead to user churn and business loss.
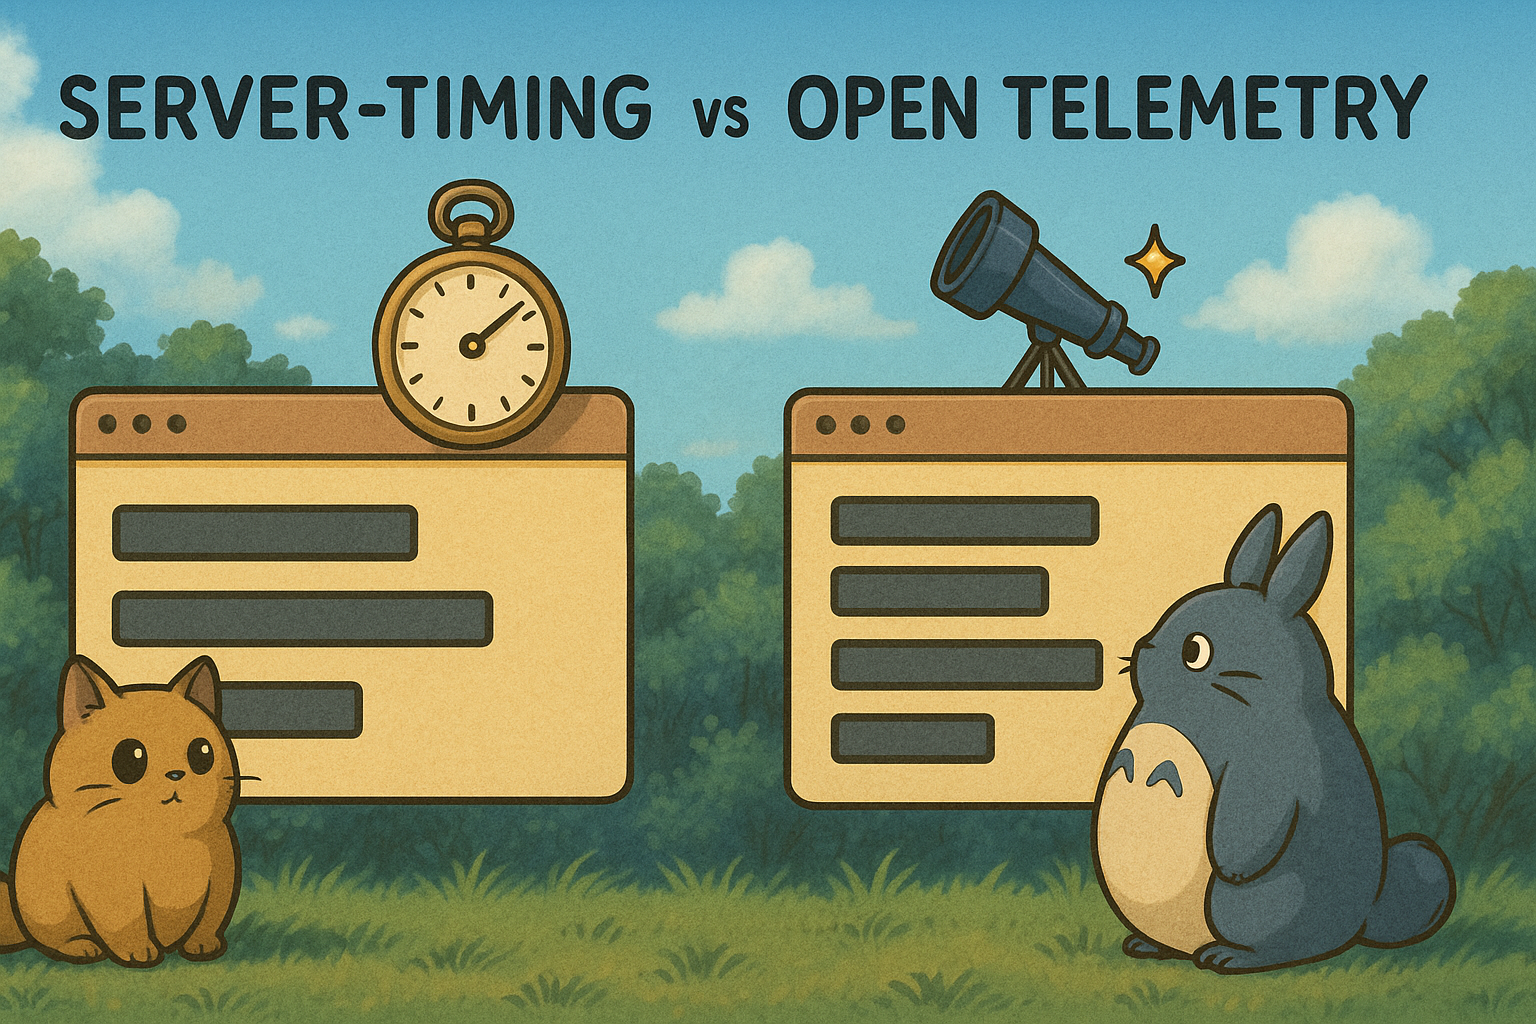
Server-Timing and OpenTelemetry (OTel) are two popular tools for API end-to-end observability, but they differ greatly in focus, application scenarios, and design philosophy. This post compares these two tools to help you determine which one best suits your project.
Server-Timing
Server-Timing is an HTTP response header defined by the W3C standard that allows servers to report performance metrics about request processing directly to the browser.
How It Works
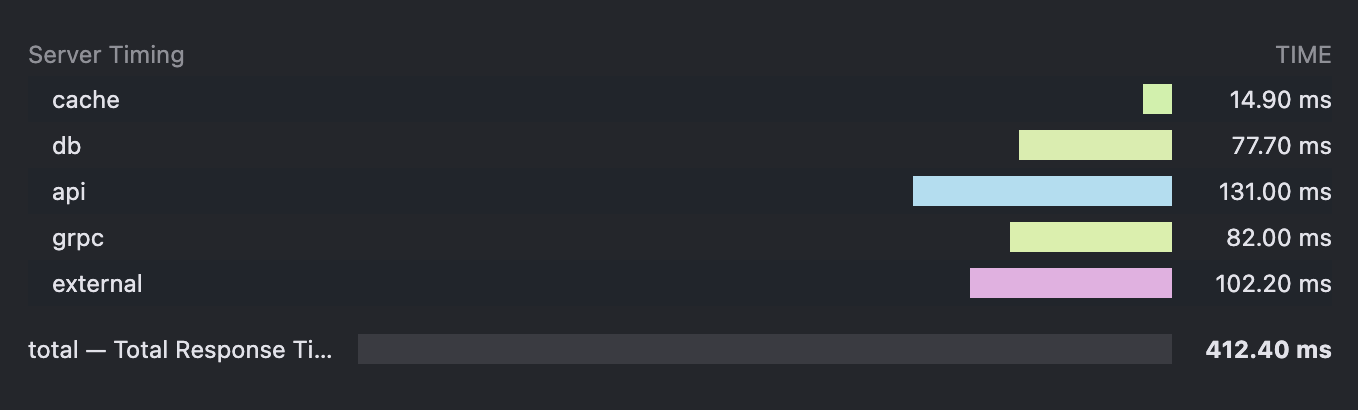
It is mainly used to reveal backend request processing latency details, and passes this information directly to the frontend. It typically includes three attributes:
name: The name of the metric, e.g.,db,cache,api.duration: Execution time in milliseconds, abbreviated asdur.description: Description of the metric, abbreviated asdesc.
For example, to indicate a backend database call took 50ms, you can return a header like this:
Server-Timing: db;dur=50;desc="Get user info from db"
Attributes are separated by ;, and multiple metrics can be separated by commas ,.
Here’s how it appears in the browser developer tools:
Pros and Cons
Pros:
- Out-of-the-box and simple integration (for frontend): Once configured on the server, the frontend needs no additional JavaScript or libraries to see timing data directly in browser dev tools.
- Lightweight and low overhead: Just adds an HTTP header with negligible impact on performance.
- Intuitive backend timing visualization (browser-friendly): Integrates seamlessly with the browser’s network waterfall view, clearly showing backend stage durations.
- Cross-platform/language compatible: Any backend that can set HTTP response headers (Node.js, Python, Java, Go, etc.) can use it.
Cons:
- Limited to single request backend timing: Cannot trace cross-service calls, async jobs, batch processing, or other distributed workflows.
- Flat format and limited semantics: Though you can add descriptions, the structure is flat key-value pairs with minimal contextual information.
OpenTelemetry
OpenTelemetry (OTel) is an open-source observability framework incubated by the Cloud Native Computing Foundation (CNCF). It aims to provide a unified set of APIs, SDKs, and tools for collecting and exporting telemetry data (Metrics, Logs, Traces). As a vendor-neutral standard, its goal is to address the fragmentation in the observability landscape.
How It Works
Imagine a request (like clicking a webpage):
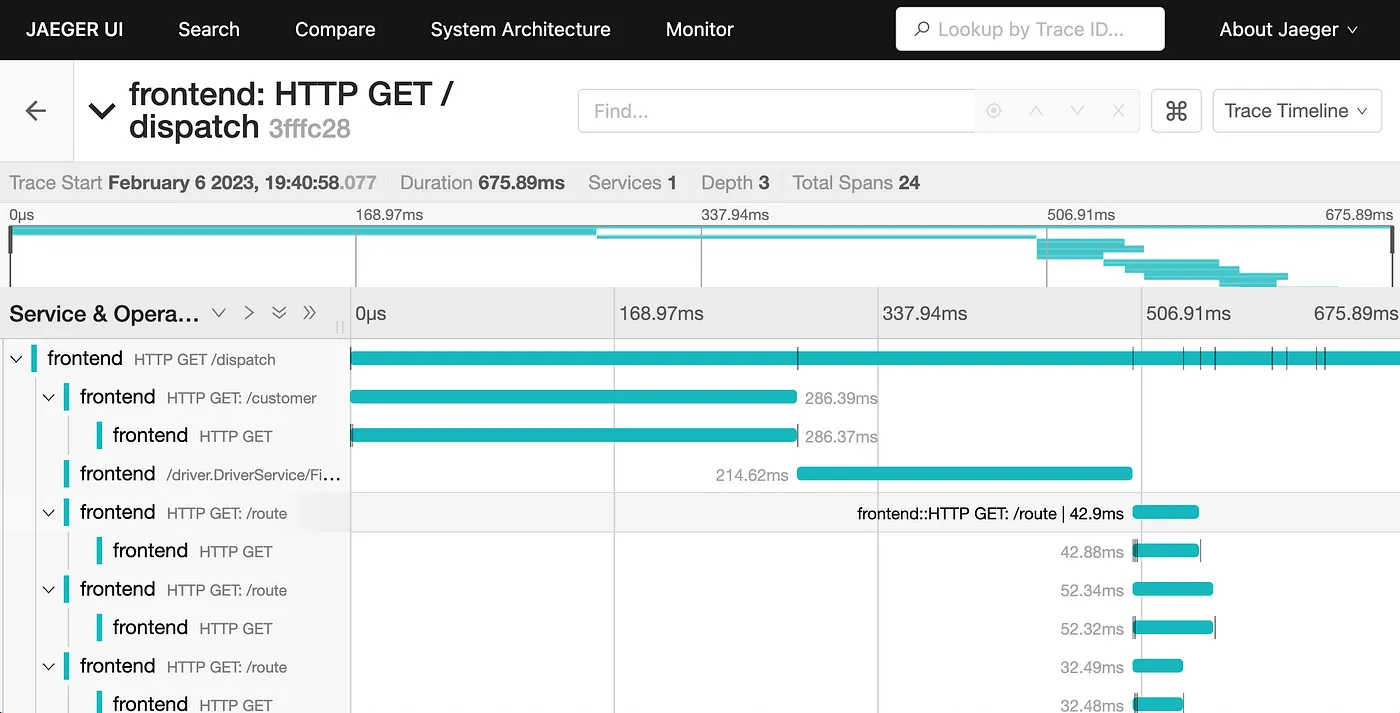
- The entire journey = a Trace: From click to page render, all backend activity is part of one "Trace", which has a unique Trace ID — like the main storyline.
- Each step in the journey = a Span: Within that journey are multiple steps such as:
- The browser sends a request (a Span).
- The gateway receives it (a Span).
- The gateway calls the order service (a Span).
- The order service queries the database (another Span).
Each Span has its own ID and duration and can carry extra metadata (e.g., the SQL query).
When one service calls another, OTel passes the current Trace ID and parent Span ID in the HTTP headers. The next service reads the headers to identify its trace and parent Span, allowing all Spans to be linked into a full request chain via parent-child relationships and a shared Trace ID.
Applications use OTel libraries (manually or automatically) to instrument these Spans. Once recorded, Spans are exported to a backend system like Jaeger, which visualizes them as call graphs. This allows developers to instantly identify slow or failing components.
Pros and Cons
Pros:
- Unified context across logs and traces.
- Distributed tracing: Its core strength—shows how a request flows through a microservices architecture, where bottlenecks and failures occur.
- Rich contextual data: Each Span can carry attributes like user ID, order ID, service version, request parameters, etc., which is invaluable for debugging and analysis.
- Highly programmable and customizable: Developers can programmatically create Spans, attach attributes, and log events for fine-grained monitoring.
- Vendor-neutral and broad ecosystem: OTel data can be exported to any OTel-compliant backend (e.g., Jaeger, Zipkin, Prometheus, Grafana Loki, or commercial APMs like Datadog, New Relic, Dynatrace), avoiding vendor lock-in.
- Advanced analysis and automation: Data can be aggregated, analyzed, visualized in dashboards, used for alerting, or even drive automated operations.
Cons:
- Learning curve: Concepts like Traces, Spans, Context Propagation, and Exporters take time to understand.
- Code intrusiveness (relatively): Requires manual or automatic instrumentation, especially challenging in large or legacy systems.
- Deployment and maintenance complexity: You need to deploy a Collector, choose or set up storage/analysis tools (e.g., Jaeger, Grafana Mimir/Loki), and maintain them.
- Performance overhead (relative): Although well-optimized, the volume of tracing data adds more overhead compared to simple HTTP headers—especially in high-concurrency environments, where careful sampling is needed.
Comparison Summary: Server-Timing vs. OpenTelemetry
| Feature | Server-Timing | OpenTelemetry |
|---|---|---|
| Core Purpose | Quickly informs the frontend of backend single request timing. | Provides full-stack, end-to-end telemetry (Logs, Metrics, Traces) for distributed observability. |
| Data Type | Flat key-value timing info (via HTTP Header). | Structured Spans, Traces, Metrics, and Logs. |
| Scope | Backend processing of a single HTTP request. | Complete request chains across services, processes, and languages. |
| Integration | Very simple (no frontend code), backend only needs to modify headers. | Complex, requires code instrumentation, concept understanding, and backend setup. |
| Performance | Very low overhead. | Relatively high, due to large data volumes; requires sampling and transport tuning. |
| Visualization | apiping.io, browser developer tools (Network Tab). | Professional APM tools (Jaeger, Grafana, Datadog, etc.). |
| Context Info | Limited, only timing description. | Rich, can include arbitrary business attributes and events. |
| Analysis Power | None, one-time display only. | Powerful, supports aggregation, trend analysis, alerting, and bottleneck detection. |
| Best Use Case | Quick debugging, basic backend performance overview. | Microservices, distributed systems, complex workflows, full-chain troubleshooting, long-term monitoring. |
| Vendor Lock-in | None. | Vendor-neutral, exportable to any OTel-compatible backend. |
Conclusion
For most projects, it’s recommended to start with Server-Timing as a performance observability tool. It’s essentially free to implement and offers immediate performance insights without introducing monitoring complexity. It gives you the closest user-facing view of site or app performance and helps you identify which part of the API flow deserves the most optimization attention.